Notas del Jueves
August 21,2025
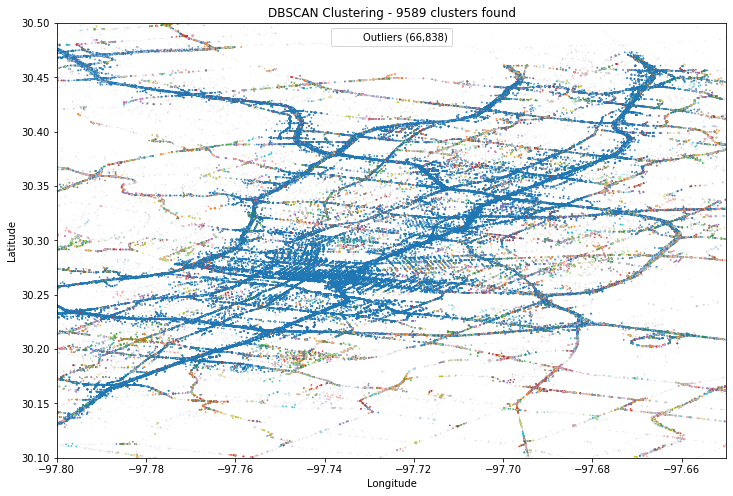
Zooming in on the data
Code courtesy of Olga Leiton, see the last three lines.
# eps = neighborhood size, min_samples = points to form a dense cluster
dbscan = DBSCAN(eps=0.01, min_samples=5)
clusters = dbscan.fit_predict(X_scaled)

# Add results to dataframe
data['cluster'] = clusters

plt.figure(figsize=(10,6))
plt.scatter(data['Longitude'], data['Latitude'], c=data['cluster'], cmap='tab10', s=0.10)
plt.xlabel("Longitude")
plt.ylabel("Latitude")
plt.title("DBSCAN Clustering of Traffic Incidents in Austin")

# Zoom in
plt.xlim(-97.8, -97.65)   # Rango en eje X (Longitude)
plt.ylim(30.1, 30.5)     # Rango en eje Y (Latitude)
plt.show()
Another look at Austin Traffic Data
Code courtesy of Yassir Jimenez Carballo.